測定結果をビジュアルに③四つのBME680のデータを表示<その1>
前回、温度のデータを使ってゲージを描画しました。ここではBME680が出力する四つのデータを同時に表示する方法を考えます。最初はiframeを用いる方法です。
●プログラム
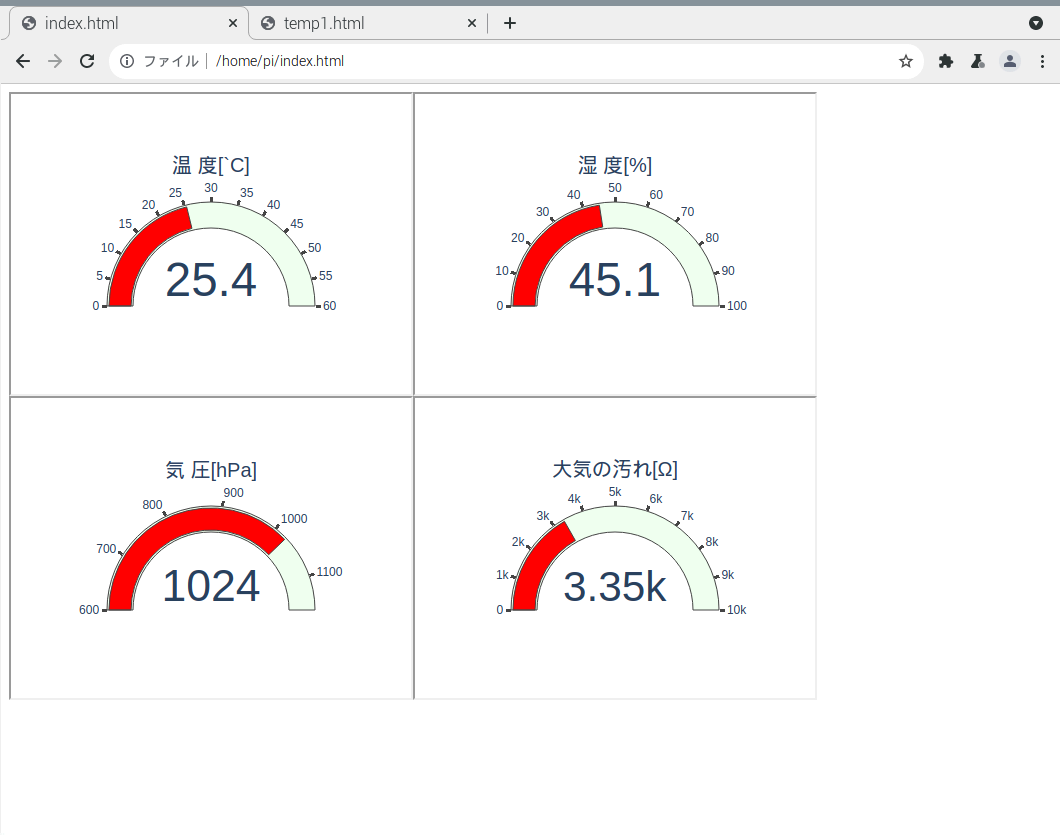
温度はtemp1.html、湿度はtemp2.html、気圧はtemp3.html、空気の汚れはtemp4.htmlに出力します。それらをindex.htmlのページにiframeでまとめて表示させます。
全体にもたもたした表示になりました。time.sleep(2)で時間を調整していますが、ときどき絵が抜けることがあります。
import plotly.graph_objects as go
import subprocess
import time

def drawGauge(value,legendgrouptitle_text,gauge_axis_dtick,gauge_bar_color,gauge_bgcolor,gauge_axis_range,title,URL):
    fig = go.Figure(go.Indicator(
        mode = "gauge+number",
        value = value,
        legendgrouptitle_text = legendgrouptitle_text,
        domain = {'x': [0, 1.0], 'y': [0, 1.0]},
        gauge_axis_dtick= gauge_axis_dtick,
        gauge_axis_tickwidth=3,
        gauge_bar_color=gauge_bar_color,
        gauge_bar_line_width=1,
        gauge_bar_thickness=0.85,
        gauge_bgcolor=gauge_bgcolor,
        gauge_axis_range=gauge_axis_range,
        title = {'text': title}
        ))
    fig.write_html(URL)

f = open('/home/pi/index.html','w')
f.write('<meta http-equiv="Content-Type" content="text/html; charset=UTF-8">')
f.write('<META HTTP-EQUIV="Refresh" CONTENT="9">')
f.write('<iframe border=0 src="/home/pi/temp1.html" width=400 height=300></iframe>')
f.write('<iframe border=0 src="/home/pi/temp2.html" width=400 height=300></iframe>')
f.write('<iframe border=0 src="/home/pi/temp3.html" width=400 height=300></iframe>')
f.write('<iframe border=0 src="/home/pi/temp4.html" width=400 height=300></iframe>')

while 1:

    ft = open('/sys/bus/i2c/devices/1-0076/iio:device0/in_temp_input')
    Temp = round(int(ft.read()) / 1000.0, 1)
    ft.close()
    drawGauge(value=Temp,legendgrouptitle_text="`C",gauge_axis_dtick=5,gauge_bar_color="RED",gauge_bgcolor="#efe",gauge_axis_range=list([0,60]),title="温 度[`C]",URL="/home/pi/temp1.html")
    time.sleep(2)

    fh = open('/sys/bus/i2c/devices/1-0076/iio:device0/in_humidityrelative_input')
    Humi = round(float(fh.read().replace( '\n' , '' )) , 1)
    fh.close()
    drawGauge(value=Humi,legendgrouptitle_text="%",gauge_axis_dtick=10,gauge_bar_color="RED",gauge_bgcolor="#efe",gauge_axis_range=list([0,100]),title="湿 度[%]",URL="/home/pi/temp2.html")
    time.sleep(2)

    fp = open('/sys/bus/i2c/devices/1-0076/iio:device0/in_pressure_input')
    Press = round(float(fp.read()) , 1)
    fp.close()
    drawGauge(value=Press,legendgrouptitle_text="hPa",gauge_axis_dtick=100,gauge_bar_color="RED",gauge_bgcolor="#efe",gauge_axis_range=list([600,1160]),title="気 圧[hPa]",URL="/home/pi/temp3.html")
    time.sleep(2)

    fa = open('/sys/bus/i2c/devices/1-0076/iio:device0/in_resistance_input')
    Air = int(fa.read())
    fa.close()
    drawGauge(value=Air,legendgrouptitle_text="ohm",gauge_axis_dtick=1000,gauge_bar_color="RED",gauge_bgcolor="#efe",gauge_axis_range=list([0,10000]),title="大気の汚れ[Ω]",URL="/home/pi/temp4.html")
    time.sleep(2)
    f.flush()

    time.sleep(2)
f.close()
実行例です。
●大気の汚れのエラー
頻度高く、大気の汚れの読み出しでI/Oエラーがでます。データが入っていないのか、何らかのゴミ・データが書き込まれているようです。
while文のところで、対応をしました。表示データとしてはおかしいですが、プログラム自体は止まらないで済みます。
while 1:

    ft = open('/sys/bus/i2c/devices/1-0076/iio:device0/in_temp_input')
    try:
        Temp = round(int(ft.read()) / 1000.0, 1)
    except:
        Temp = 1
    ft.close()
    drawGauge(value=Temp,legendgrouptitle_text="`C",gauge_axis_dtick=5,gauge_bar_color="RED",gauge_bgcolor="#efe",gauge_axis_range=list([0,60]),title="温 度[`C]",URL="/home/pi/temp1.html")
    time.sleep(2)

    fh = open('/sys/bus/i2c/devices/1-0076/iio:device0/in_humidityrelative_input')
    try:
        Humi = round(float(fh.read().replace( '\n' , '' )) , 1)
    except:
        Humi = 1
    fh.close()
    drawGauge(value=Humi,legendgrouptitle_text="%",gauge_axis_dtick=10,gauge_bar_color="RED",gauge_bgcolor="#efe",gauge_axis_range=list([0,100]),title="湿 度[%]",URL="/home/pi/temp2.html")
    time.sleep(2)

    fp = open('/sys/bus/i2c/devices/1-0076/iio:device0/in_pressure_input')
    try:
        Press = round(float(fp.read()) , 1)
    except:
        Press = 1
    fp.close()
    drawGauge(value=Press,legendgrouptitle_text="hPa",gauge_axis_dtick=100,gauge_bar_color="RED",gauge_bgcolor="#efe",gauge_axis_range=list([600,1160]),title="気 圧[hPa]",URL="/home/pi/temp3.html")
    time.sleep(2)

    fa = open(r'/sys/bus/i2c/devices/1-0076/iio:device0/in_resistance_input')
    try:
        Air = int(fa.read())
    except:
        Air = 1
    fa.close()
    drawGauge(value=Air,legendgrouptitle_text="ohm",gauge_axis_dtick=1000,gauge_bar_color="RED",gauge_bgcolor="#efe",gauge_axis_range=list([0,10000]),title="大気の汚れ[Ω]",URL="/home/pi/temp4.html")
    time.sleep(2)
    f.flush()

    time.sleep(2)
f.close()